Loading — one moment.
Free GITDM guide
Market Basics — free guide
A friendly first look at markets, charts and risk for anyone deciding whether to study with us.

Loading — one moment.
Loading the store — one moment.
Free GITDM guide
A friendly first look at markets, charts and risk for anyone deciding whether to study with us.

A market is one of the oldest ideas in human trade. It is the place where someone who wants to sell stands across from someone who wants to buy, and where the two settle on a price. The maize seller at a Ugandan market and a bank in London trading one currency for another are doing the same basic thing: exchanging something, at a price, because each of them believes the deal leaves them better off.
Financial markets are that same meeting place, but for money, debt, shares and the right to buy or sell later. Their real job is not to make traders rich. Their job is to set prices, and prices are how an economy decides where to send its resources. When the price of coffee rises, more farmers plant coffee. When a country's currency weakens, its exports look cheaper to outsiders and its imports look dearer. When share prices in a sector climb, capital flows toward it. You are watching a giant, constant argument about what things are worth, conducted in numbers.
Nothing in a market stands still. Every hour, somewhere, a central bank decides whether to change interest rates, a company reports earnings, a war starts or a peace holds, a harvest is announced, an election result comes in, a fund needs to rebalance. All of that arrives as new information, and the price adjusts to absorb it. This is the honest reason prices move. It is not because somebody is manipulating you, though manipulation exists. It is because a price is a live summary of what everyone currently believes.
This is the first idea that confuses every beginner, so let us say it plainly. Prices do not reflect what happens. They reflect what happens relative to what people expected would happen. If a country's economy grows, and everyone predicted that growth months ago, the price may fall, because the good news was already bought. If inflation comes in only slightly worse than forecast, the reaction can be violent, because the forecast, not the number, was the baseline. When you later hear a trader say "the market had already priced that in", this is what they mean.
Money and rates. The price of borrowing decides how much spending happens anywhere. When rates are high, cash earns a return and risky assets look less attractive. When rates are low, money hunts for yield and prices of shares and property tend to be supported.
Growth and profits. Economies expand or shrink. Businesses earn or lose. Households hire or stop hiring. Over weeks and months, this is what carries prices in the end.
Trust and fear. Participants are people. Confidence can rise quickly and vanish faster. When fear spikes, everyone wants the same safe things at the same time, and prices move far past what the fundamentals alone would explain.
One more thing, and it matters more than everything above. Markets are not a machine that reliably pays anyone who studies them. Trading involves real risk of loss, including the loss of all the money you put in. Surveys of retail clients published by regulators across the world consistently show that most individual traders lose money over time. Nothing in this guide is investment advice, a recommendation, or a promise of any return. It is a map of the territory so that you can decide, clear-eyed, whether you want to walk into it.
An "instrument" is simply a standard thing that many people agree to buy and sell, so that a price can form for it. You will hear five families discussed constantly. Learn what each one actually is before you ever trade one.
Currencies are traded in pairs, because you always give one to get another: the euro against the US dollar, the South African rand against the dollar, the Ugandan shilling against the dollar. A currency pair's price tells you how many units of the second currency one unit of the first buys. This market is enormous, open roughly twenty-four hours across the working week, and it is where most of the price action you read about in the news actually happens. Currency values are driven heavily by interest rate differences, trade flows, and confidence in a country's management of its own economy.
A share is a piece of ownership in one business. Owning a share means you own a claim on part of that company's future profits and, in many cases, a vote. An index is a basket: a single number representing the value of a group of shares chosen by a rule, such as the fifteen largest listed companies on the Nairobi Securities Exchange, or the twenty firms on the Uganda All-Share Index. Trading an index spreads your risk across many businesses at once, which is why beginners usually find it calmer than a single share. Shares pay dividends when a company chooses to distribute profits. Indices do not have dividends of their own, but the shares inside them do, and that shows up in the price.
Commodities are physical things: gold, silver, crude oil, coffee, sugar, cotton, wheat, cocoa. Coffee is worth watching from a Ugandan seat; we grow a well-regarded arabica and its world price moves for reasons that are partly weather and partly the global economy. Commodity prices are set in dollars, so a change in the dollar shifts what those goods cost in shillings even when the goods themselves have not changed.
A derivative is a contract whose value is derived from something else. A futures contract is an agreement to buy or sell a set quantity at a fixed price on a future date. An option gives the holder the right, but not the obligation, to buy or sell at an agreed price before a deadline. A spread bet or a contract for difference is a private agreement between you and a counterparty to exchange the difference in an instrument's price between two moments. Derivatives were not invented for speculation; they were invented for farmers, airlines and exporters to lock in costs. Speculators then supplied the other side, and that is genuinely useful, because it lets a coffee cooperative fix a price today for coffee it will harvest next year.
Understand two things about derivatives before anything else. First, they usually let you control a large position with a small deposit, which multiplies both outcomes. Second, they carry costs a normal share purchase does not, most importantly an overnight financing charge. Many beginners treat a derivative like a share and are surprised by the bill.
For every buy there must be a sell. Ask yourself who is selling to you, and who is buying from you, and the market becomes far less mysterious.
The largest participants are institutions: pension funds, insurance companies, banks, asset managers, corporations hedging their own exposures. These are the flows that move prices. A fund that must reduce its holdings of East African shares this month will do so whether or not the chart looks friendly. Then there are market makers, firms whose business is to quote both a buying and a selling price at all times and earn the gap between them. They are paid for letting you get in and out quickly, and they also take risk, which is why their quotes widen violently in a crisis.
You are a small participant, and that is worth saying out loud. You are not competing on information, speed or size against a bank's trading desk. What you can compete on is patience, preparation, position size and the choice of when not to act. Those are real advantages, and they are the only ones a beginner honestly has. Three considered trades a month leave you no worse off than three hundred a week.
Some brokers route your order to outside liquidity. Others take the other side of your trade internally, or hedge only part of it. Neither arrangement is automatically dishonest, and the second can give you a smoother, faster fill. But you should know which one you are using, because it tells you where the interest lies when something goes wrong. Read the disclosure section of a broker's client agreement. It is dull and it tells you a great deal.
Most losses beginners take are not caused by other people. They are caused by acting as though the market owes a living to every participant. It does not. The market is a place where the impatient pay the patient and costs quietly eat the careless. Your aim in the first year should be to become someone whose costs and behaviour are not an easy meal.
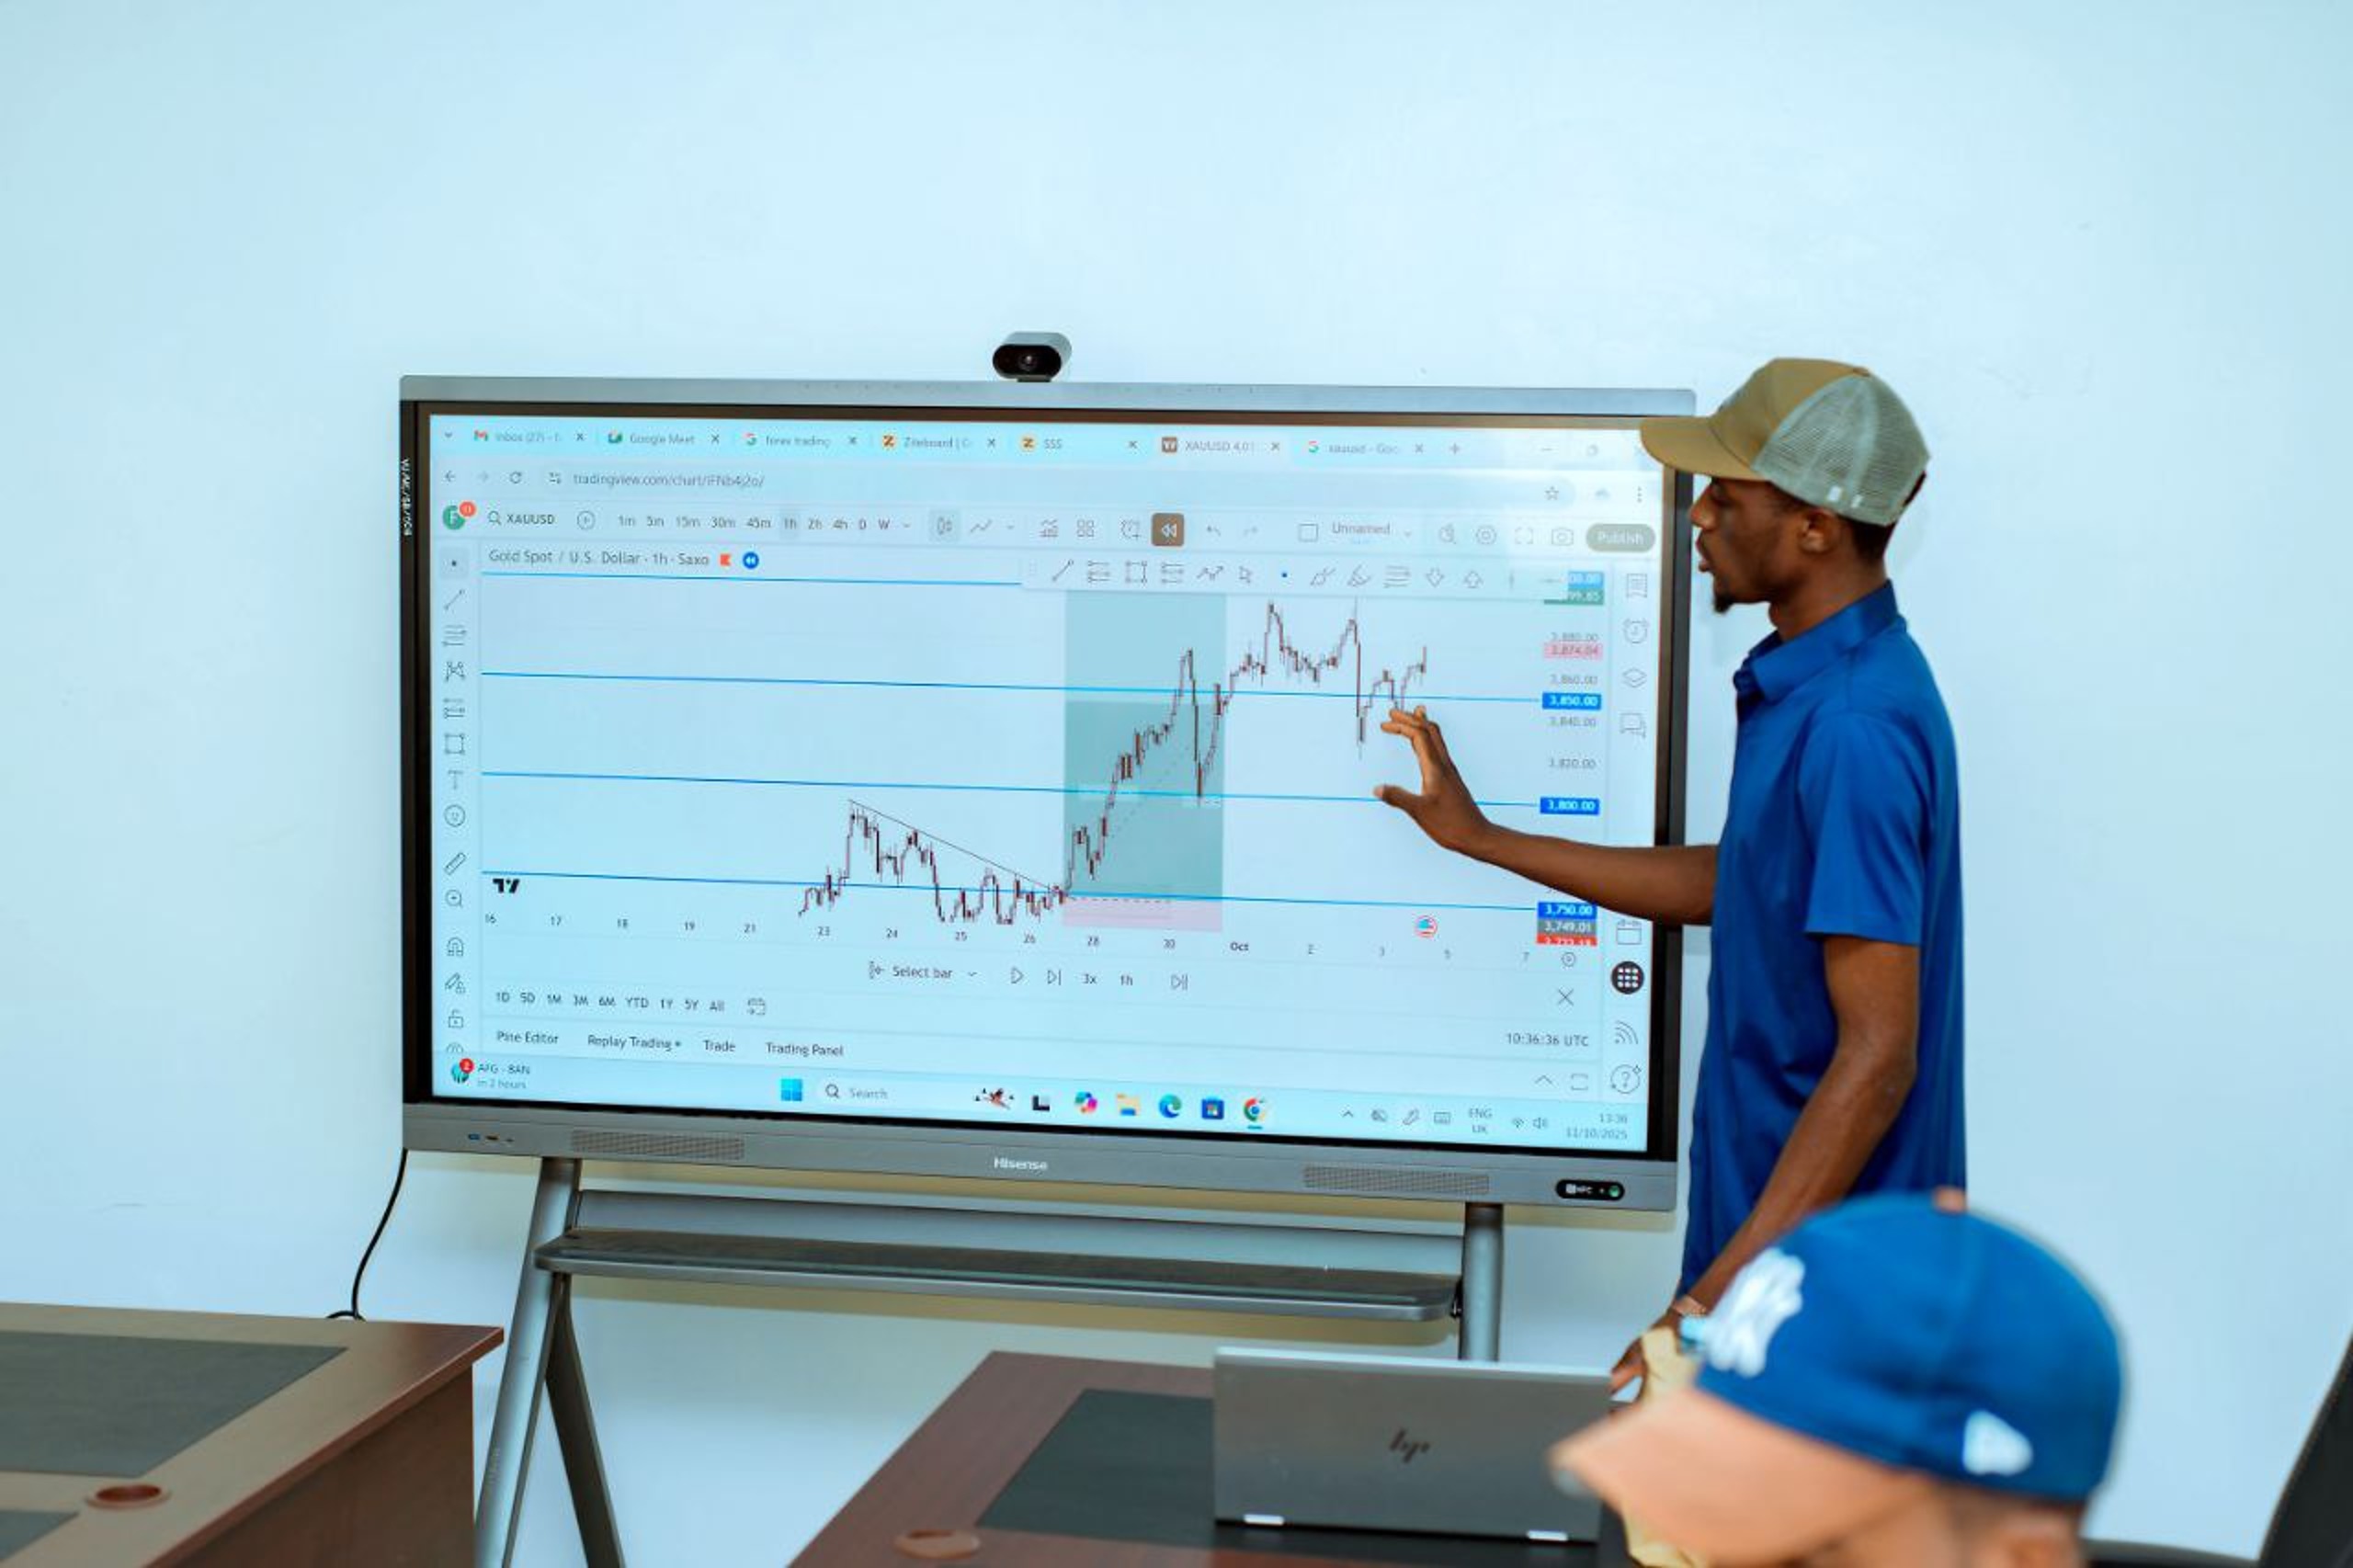
A chart is a record of prices over time, and nothing more. It does not predict. It describes. Beginners usually want the prediction first and never build the description, which is exactly backwards.
A candlestick packs four numbers into one shape: the price at the start of the period, the highest price reached, the lowest price reached, and the price at the end. If the close is above the open, the body is usually drawn in one colour and means the period ended higher than it began. If the close is below the open, it is drawn in another colour and means the opposite. The thin lines above and below the body are the wicks, and they show where price went and was rejected. One candle gives you a small story: who pushed, who resisted, and who finished the period ahead.
The same market can be drawn on many timeframes. A ten-second chart is mostly noise and a poor teacher. A five-minute chart shows an hour's argument, a daily chart shows what people believed over weeks, and a weekly chart shows the tide. Higher timeframes carry more information per candle; lower ones demand faster decisions from you. If you have a job, a family or studies, be honest about which timeframe you can watch without damaging your life. There is no prize for the shortest one.
Markets spend a minority of the time going somewhere and the majority going sideways. A trend is a sequence of higher highs and higher lows in an upward move, or lower highs and lower lows in a downward one. A range is price bouncing between a level where sellers appear and a level where buyers appear, without resolving either. Most beginner frustration comes from using a trend idea inside a range, or a range idea inside a trend. Before you ask "where do I enter", ask "which state is this market in". A market that is going nowhere will punish every technique built for movement.
Do that twenty times and you will know more about reading price than someone who watched two hundred hours of clips.
A broker sits between you and the market. It holds your money, converts your instruction into an order, shows you prices, and reports what happened afterwards. Because it does all of that, choosing one is a serious decision, and it is a decision you should make before you are excited about a trade.
When you press buy, a chain runs. Your account has been funded and is segregated, meaning ideally held apart from the firm's own money. Your order has been priced, possibly quoted by the broker itself, then routed to liquidity or matched internally, then filled and recorded so you can complain later. Each stage is a place where a poor firm can hurt you: delayed withdrawals, requotes, spreads that widen at the moment you act, or records that do not match your memory.
In Uganda the Capital Markets Authority is the national regulator for the securities market. It licenses dealers, advisers, exchanges and funds, maintains registers of the entities it authorises, and handles complaints from the public. Before you give any firm money, check whether it appears on the Authority's register and whether the activity you are being offered is actually within its licence. A licence is not a guarantee of good service; it is proof that a firm agreed to be supervised and that there is somewhere to complain. Offshore brokers frequently market to Ugandans without any local licence at all. That is your risk to weigh, and many people weigh it wrongly because a slick app feels like safety.
Say it clearly once more: GITDM is a school. We teach. We are not affiliated with any broker, any liquidity provider, any exchange or any regulator, we do not accept referral payments from brokers, and we do not recommend one over another. If a person claims to be teaching on our behalf while urging you to open an account with a particular firm, that is not us.
This chapter is the one that decides whether you survive long enough to learn anything. Analysis is interesting; money management is what keeps you in the room.
The buy price is almost always a little higher than the sell price. That gap is the spread, and it is the fee you pay for being able to enter and leave. The moment you buy, you are down by the spread. On a liquid major currency pair at quiet hours it may be tiny. On an exotic pair, a small share, or a gold contract during a news release, it can be many times wider, exactly when you most want to act. Add up your spreads at the end of a month of overtrading and you will often find the true reason you lost.
Leverage lets you control a position much larger than the money you commit. Put down a ten percent margin requirement and your exposure is ten times your deposit. Now multiply every outcome by ten, including the bad ones. Margin is the deposit the firm holds against that exposure. If the market moves against you and your remaining equity falls toward the required margin, you will get a margin call, and if it falls further your positions are closed automatically at whatever price the market offers. Stop outs are not always at your chosen level, and in fast markets they can be much worse. Leverage is not extra money; it is extra speed in both directions.
A stop loss is an instruction to close a position if price reaches a level that proves your idea wrong. Decide that level before you enter, based on the chart, not on how much you are willing to lose. Then size the position so the loss at that level is a number you can absorb. Widening a stop after the fact is how a small, planned loss becomes a large, unplanned one. Gaps through a stop are possible, so a stop is a discipline, not a guarantee.
Take a beginner account of UGX 1,000,000 and a rule of risking between one and two percent of the account on any single trade. Here is what that rule actually means in money, and what a bad run looks like. Figures are rounded and ignore costs and compounding.
| Account balance (UGX) | Risk at 1 percent (UGX) | Risk at 2 percent (UGX) | Balance after five losses at 2 percent (UGX) |
|---|---|---|---|
| 1,000,000 | 10,000 | 20,000 | 900,000 |
| 1,500,000 | 15,000 | 30,000 | 1,350,000 |
| 2,500,000 | 25,000 | 50,000 | 2,250,000 |
| 5,000,000 | 50,000 | 100,000 | 4,500,000 |
| 10,000,000 | 100,000 | 200,000 | 9,000,000 |
Notice the last column. Five losses in a row is not a catastrophe at two percent; it is a normal, dull week. The same five losses at ten percent risk would leave a UGX 1,000,000 account at UGX 500,000, and most people cannot think clearly with half their money gone. Now the practical problem: the risk budget has to be converted into a position size.
| Distance from entry to stop (pips) | Budget per pip at UGX 10,000 risk | Budget per pip at UGX 20,000 risk |
|---|---|---|
| 20 | UGX 500 | UGX 1,000 |
| 40 | UGX 250 | UGX 500 |
| 50 | UGX 200 | UGX 400 |
| 100 | UGX 100 | UGX 200 |
Here is the honest teaching point. On a standard currency contract, the smallest commonly offered size is one micro lot, which is worth roughly USD 0.10 per pip. At an illustrative rate of around UGX 3,800 to the dollar, that is close to UGX 380 per pip. With a 50-pip stop you are risking near UGX 19,000, which is just under two percent of a UGX 1,000,000 account. Workable, but with almost no room, and the exchange rate you actually get may not be the one used here. Check your broker's contract size, pip value and currency of quotation yourself; never copy a size from a video.
And once again, stated for the record: most retail traders lose money, and trading carries the risk of losing everything you deposit. These tables are arithmetic, not advice, and no method shown here protects you from a bad decision or a bad market.
A plan is a short document that says what you will do before you are emotionally involved. Its value is not accuracy; it is that it forces you to commit to something falsifiable while you are calm, so that you can judge yourself later on evidence rather than on mood.
Trade plan
Date and time: ____________________
Instrument and timeframe: ____________________
Market state (trending or ranging) and my evidence: ____________________
My reason for this trade, in one plain sentence: ____________________
What must happen for the idea to be valid: ____________________
What must happen that would prove me wrong: ____________________
Entry, stop and target prices: ____________________
Money I will risk, in UGX and as a percent of my account: ____________________
Position size that produces that risk: ____________________
Expected reward divided by risk: ____________________
When I will review, and what I will do if nothing happens: ____________________
My behaviour rule for this trade (one only): ____________________
| Field | Entry | Note |
|---|---|---|
| Instrument | Euro against the US dollar, daily | Chosen because I have watched it for three weeks. |
| State | Ranging between two drawn levels | Evidence: four touches either side, no daily close beyond them. |
| Idea | Buy near the lower level | Reason: sellers have not held it through a close. |
| Invalidation | Daily close below the level | If that prints, I am wrong and I leave. |
| Stop | 50 pips below entry | Set by the chart, not by my comfort. |
| Risk | UGX 19,000 | About 1.9 percent of a UGX 1,000,000 account. |
| Size | One micro lot | Illustrative. Verify contract value and quote currency yourself. |
| Reward to risk | About 1.6 to 1 at the upper level | Below my 2 to 1 rule, so the honest answer here is no trade. |
Read that last line again. The plan's job is partly to disqualify trades, and a plan that rejects the idea is a plan that has worked.

Progress in this field comes from a loop: act, record, review, adjust, repeat. Without the record, there is nothing to review, and you will make the same expensive mistake quietly for years.
Keep it small enough that you will actually fill it in. For each trade: the date and time, the instrument, the plan reference, the entry, stop and target, the size, the risk in UGX, the outcome, and one line on what you felt while it was open. Add a screenshot of the chart at entry and at exit. That last item is the one people skip and the one that settles arguments with yourself later.
Losing streaks arrive even for people doing good work, because a strategy that wins most of the time still has clusters of losses. The question that matters is not "am I losing" but "am I losing the way I planned to". Small, planned, boring losses inside a process you can describe are a working account. Large, unexpected, emotional losses that you cannot explain are the warning sign, and the correct response to that warning is to stop trading, not to trade harder.
Practise this habit first on money you cannot afford to lose, or on no money at all. Practice before capital is not a polite suggestion; it is the cheapest tuition available to you.
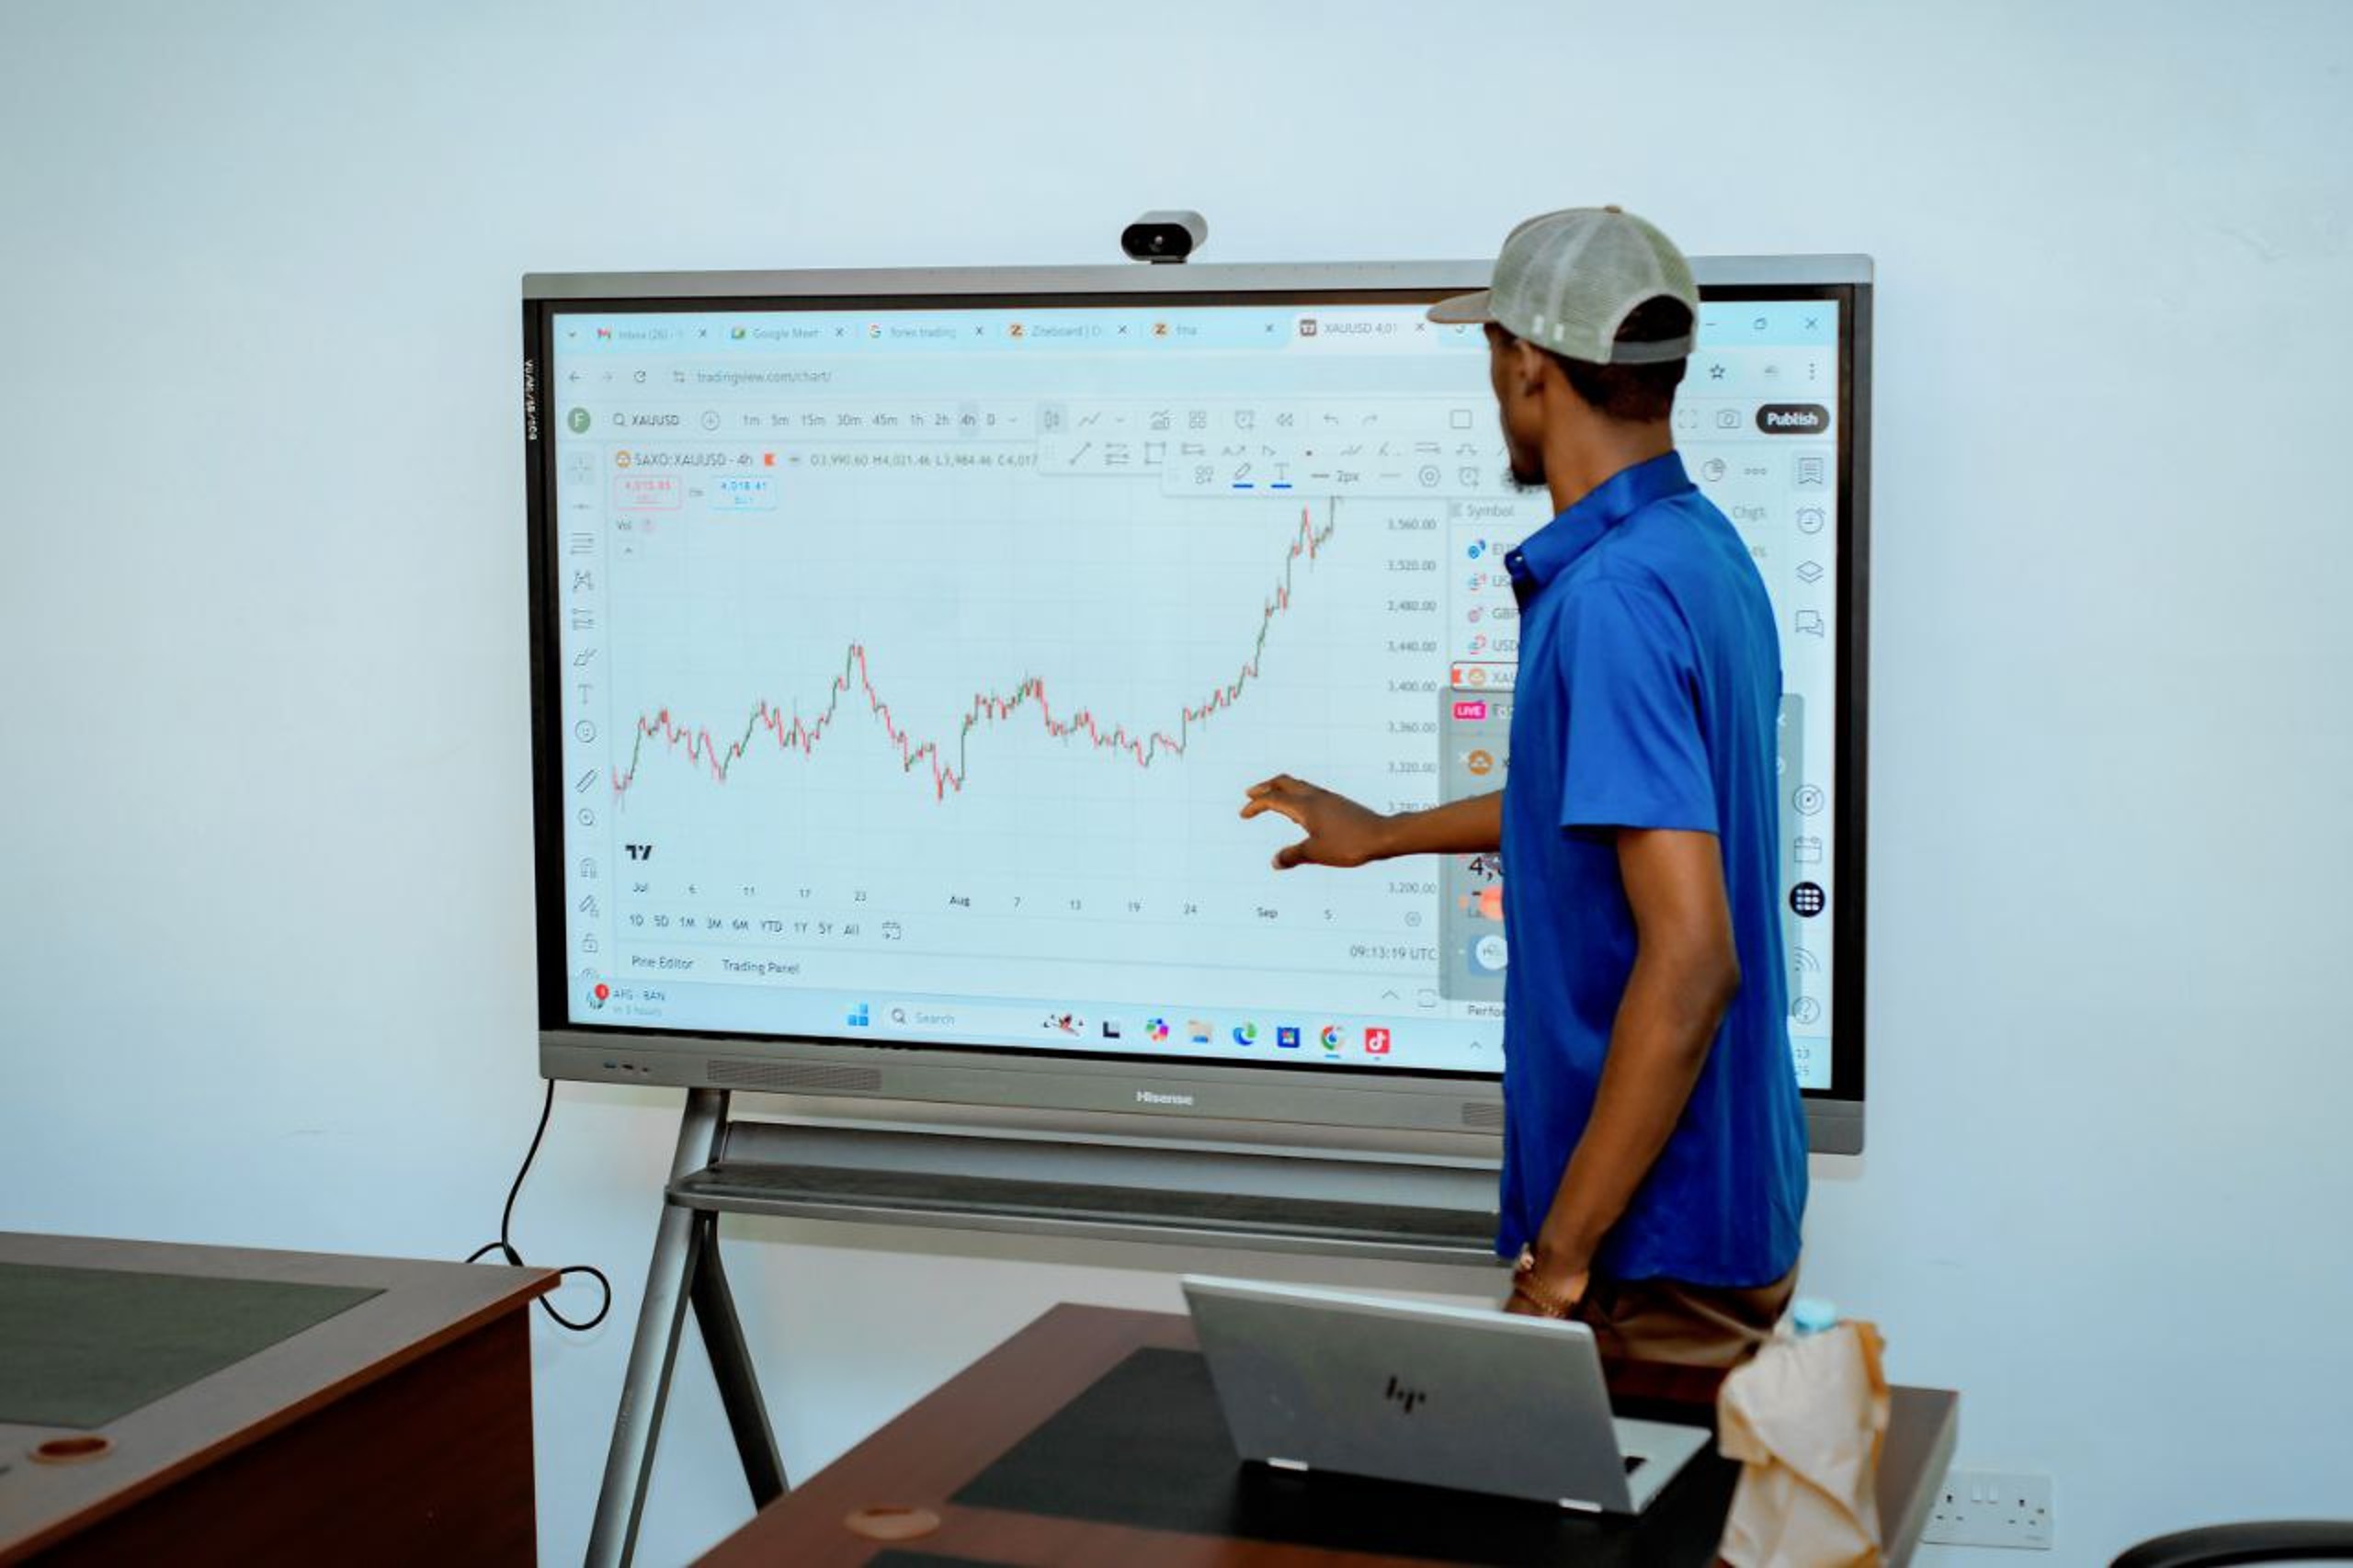
You have now read the whole map in outline: what a market is, what trades inside it, who else is there, how price is drawn, who holds your money, how risk is measured, and how to write down what you intend to do. That is enough to begin properly. It is not enough to trade with confidence, and we would rather you knew that than the opposite.
GITDM runs structured programmes for people starting from nothing, taught in small groups by instructors who trade and teach. The Foundations of Markets course covers exactly the ground in this guide and then goes deeper into money management, the mechanics of orders, and how to read economic news without panicking. The Forex Trading programme adds session behaviour, currency drivers, and a full supervised practice period before any live money is discussed. The Technical Analysis programme concentrates on structure, levels, chart states and evidence-based review. Alongside these we run an Institutional and Foundations track for people who want to work inside the industry rather than trade their own money, and short weekend workshops on single topics.
Classes are taught at our premises in Kampala, in small cohorts, with live charts, set exercises and one-to-one coaching time. Admission is open to anyone who can commit to the sessions; there is no entrance test and we do not select students on how much money they have.
You do not need to pay us to learn the fundamentals. Ask at the front desk about our open evening sessions, public study groups and lending shelf of market classics. Alumni run weekly review meet-ups that visitors may attend, and we publish plain-language notes on the topics covered here, free to share with anyone curious and short of funds.
Three closing sentences, and we mean all of them. Trading involves the risk of loss, and you should only ever use money whose loss your life can absorb. Nothing written in this guide is investment advice, a recommendation to buy or sell anything, or a promise or projection of returns; any person who promises you returns is not teaching you markets. And if, after reading all of this, you decide markets are not for you, that is a successful outcome and we will say so to your face.
If you decide it is for you, come and see us. Bring your two weeks of paper logs. That is the only prerequisite we have.